The Data Analysis page will go through various graphs that I have constructed. Each graph analyzes different weather trends and patterns. Ultimately, the graphs are able to highlight either the consistency or the variability of weather patterns from each year.
29 Year Tempurature Trend:

The trend and the average are pretty similar, although the trend looks like it is slightly increasing over the past 130 years. The average is 22.47 degrees F from 1895-2012, although as you can see in the graph, the data has a lot fluctuation. Some of the biggest fluctuations occurred between 1914-1915, in 1914 the average temperature for January was 14 degrees in the northeast, while in 1915 the average was 31 degrees (a 17 degree difference.) Other large fluctuation occurred between 1993-1994, between 1949-1950 and between 1931-1932. The lowest fluctuation occurred between 1952-1953, 1955-1956, 2007-2008, and 1981-1982. The overall pattern seems to be that temperature remains consistent for a period of 6 or 7 years, and then has a dramatic rise or drop, and then starts the 6 or 7 year trend of similar temperature again.
Precipitation Trend (110 years/ New England):

The average amount of rainfall was 3.14 inches. This data has a stronger mean than the temperature graph, all data on this map falls between .5 inches and 6.8 inches. The trend on this map is that the rainfall is slight decreasing over time ( a centimeter over aprx. 130 years) I don’t think that is significant enough to make claims that the northeast is continuously gettnig less precipication. The biggest flucuation in data was between 1936-1937. In 1936 the northeast received 2 inches of rain while in 1937 the northeast received 6.8 inches of rain, a 4.8 inch difference. Other big flucuations occurred between 1914-1915 with a difference of 2 inches as well as 1979-1980 with a difference of 4 inches. The least flucuation occurred between 1933-1934 with a difference of barely a centimeter, and in 1997-1998and 1963-1964 with no change in precipitation levels.
Temperature Trend (110 years, New England):

This graph shows the avereage temperature in the northeast over the course of 110 years . The information portrayed on this graph seems to support the theory of climate change. The trend (also the line of best fit) supports the thoeory that the northeast is getting slightly warmer over the course of 110 years. The trend is that the average climate has risen about 2 degrees. 2 degrees in 110 years is a very significant incline, considering our earth is billions of years old.
Climograph:

The Climograph constructed above analyzes the relationship between temperature and precipitation over the course of 29 years (between 1961 and 1990). When observing the climograph and comparing it to data collected for this previous January, it is apparent that this year has definetly been an unusual year for climate. The average temperature for the thirty year span was 15 degrees, while in 2012 the month of January had an average temperature of 23- a stark 8 degree difference! Precipitation (or rainfall) has averaged about three-quarters of an inch between 1961 and 1990. This year, rainfall was slightly above average, even though precipitation only occured during 6 days of the month. The lack of rain is most likely associated with the fact that the predominant wind direction for the month of January was from the west.

Temperatures in Eau Claire Wisconsin in the months of January, February and March (2012.)

WIND DIRECTION 2012:


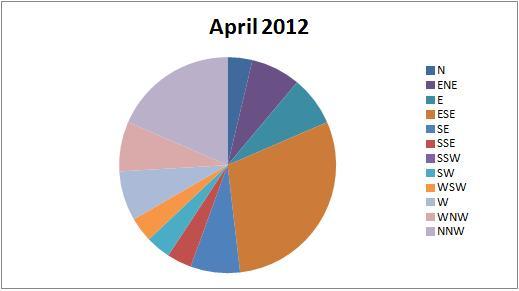
Wind maps are extremely useful to use when analyzing climate because precipitation is always associated with a prevailing wind direction. During the spring semester, January and February had mild climate which can be assocaited with the prevailing winds being predominately out of the W/NW throughout the two months. April by far had the most precipitation of all the months. During this time, the winds were mainly coming out of the SSE, E, and NE. As the semester moved on and winds shifted from the ESE which consequently brought warmer air associated with the subtropical air mass which has helped spark our spring rain showers!
OTHER WISCONSIN CITIES:
The next maps are focusing on the two main cities in Wisconsin- Madison and Milwaukee. The graphs show the average temperate for the year and month, and then the data contructs the trend (also known as the line of best fit.)
>Why are these maps included? I have included the graphs of Madison and Milwaukee in my blog to help demonstrate the importance of looking at many different areas when drawing conclusions on things such as climate change. Multiple factors can affect a city’s readings that wouldn’t affect others. Madison and Milwaukee are prime examples. Both are metropolitan areas that are affected by the urban heat island, but they are also affected by other things such as elevation and… particular lily in this case, LAKE EFFECT. J


As you can see the annual 2011 temperatures for Milwaukee and Madison follow essentially the same trend. One key factor that made winter in Milwaukee slightly warmer and summer slightly cooler than in Madison is that Milwaukee is affected by Lake Michigan. In the winter the body of water is slow to cool from an increase in temperature in the summer, therefore the water will often warm cooler air above it. This same affect happens in the summer, although it is flipped- in the summer water temperatures on Lake Michigan are cooler than the surrounding air which cools air temperatures in the summer.
Conclusion:
The abnormality of this winter can possibly be related to the fact that we were never affected by the artic airmass coming down from northern Canada and we had a jetstream that brought the warm southern air up combating the normal continental polar airmass. Precipitation was below average for the most part due to the fact that the winds were mainly coming out of the west throughout the entire winter. In order for precipitation to occur, there needed to be some southeast/east/ or northeast winds to create the formula desirable for those conditions.
No comments:
Post a Comment